

Cable gland vibration testing supports a field-performance decision when the field and laboratory records address the same physical question. I would compare waveform or time history, frequencies, severity, axes, and duration first. Then check mounting, cable support, gland configuration, and functional tests. One acceleration value cannot rank the severity of these different conditions.
A meaningful comparison starts with what each measurement represents: sensor position and direction, operating state, frequency content, amplitude definition, processing, and duration. Put the values side by side in common units. Keep the gland, cable, enclosure, support, and acceptance checks linked to that comparison. For component context, see how a cable gland interfaces with the cable and enclosure.
Key takeaways
- Treat sine, random, shock, and recorded time-history evidence as different test descriptions.
- Compare data only after matching units, frequency range, reference point, axis, bandwidth, and signal processing.
- Match the complete gland, cable, enclosure, accessory, installation and support arrangement.
- Define acceptance through retained functions and stated limits before the shaker-table run.
- Use field measurements to select or refine a laboratory test, and compare records after their common fields match.
What a real-world vibration result can establish
A field vibration result is a measurement tied to a location, direction, operating state, time window, instrument chain, and processing method. It identifies motion at that sensor under the observed conditions. Relate the record to the cable entry by tracing the structure and cable load paths, then checking sealing, retention, thread security, cable support, and each applicable electrical function.
An accelerometer—a sensor measuring acceleration—on a motor frame may read differently from one on the enclosure wall. The structure between them can filter or amplify motion. A sensor near the entry may still miss cable whip when support, free length, or the bend changes.
I would photograph or draw sensor position and orientation. Record machine speed, load, starts and stops, maintenance state, temperature, and capture duration. Those details give the spectrum a location and operating context.
The load at a gland depends on the complete assembly: the gland reference and size, cable construction and measured OD, seal and insert, thread, washer or locknut, and panel material and thickness. Add tightening instructions, fixture, cable support, exposure, and acceptance checks.
IEC 62444:2010 covers complete cable glands as supplied. I would keep the statement tied to that assembled product rather than a coupon, loose part, or unnamed family. Sample count, conditioning, test sequence, deviations and limits define which result was observed.
The assembly details, test axis and measurement time identify which load and gland condition the result describes. The drawing and installation instructions establish the setup used. The metal-versus-polymer test guide uses the same complete-assembly boundary.
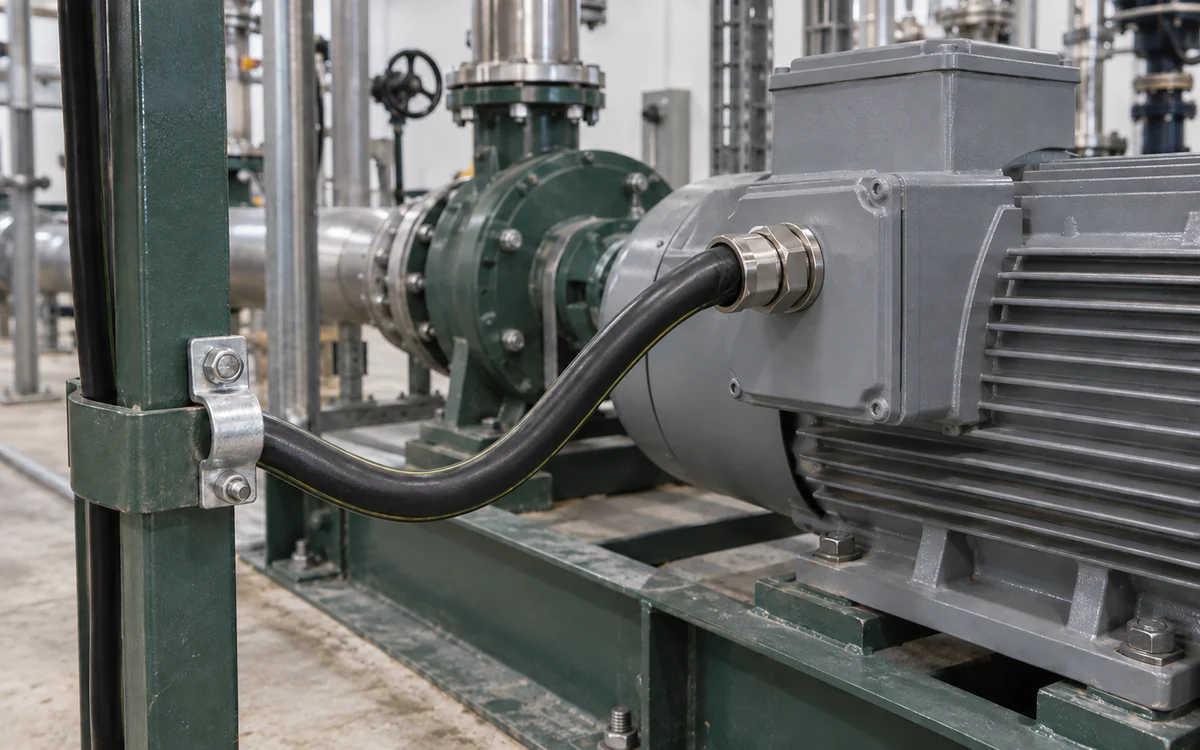
The motor terminal-box entry, cable span and separate clamp show the structural and cable load paths around the installed gland.
Laboratory specifications define controlled vibration inputs
A laboratory vibration specification combines a controlled input with the conditions used to evaluate a named specimen at a selected severity. IEC 60068-2-6 defined a sinusoidal method in 2007 for finding mechanical weakness or degradation. IEC 60068-2-64 addressed broadband random vibration in 2008. A relevant specification selects severity and acceptance for each method.
I would preserve control points, axes, tolerances, duration, mounting, response observations, and functional limits. Record interruptions, excessive or insufficient exposure, and fixture resonances too. Matching units and reference points make the field-to-laboratory comparison interpretable.
Shock is another input class. IEC 60068-2-27:2008 provides procedures for specified non-repetitive or repetitive shock pulses. Keep shock peak, random root-mean-square acceleration, and sine sweep amplitude as separate quantities. Compare shock records through pulse shape, duration, direction, repetition count, filtering, and specimen response. Select a repeated-shock endurance input from the event occurrence rate and the relevant damage mechanism.
Field records may contain random content, deterministic tones, operating transients, and stops in the same capture. IEC 60068-3-8:2003 guides selection among stationary vibration methods by first understanding or measuring the dynamic environment. If a recorded time history must be reproduced, IEC 60068-2-85:2019 provides a long-time-history replication method for application-specific tests. Use these sources to choose the method, then obtain the cable-gland profile and any scaling rule from the applicable product or application specification.
| Evidence type | What must accompany the value | Companion evidence needed |
|---|---|---|
| Sine sweep | Frequency range, amplitude form, sweep rate, axes, dwell and control point | Separate random-endurance and shock records |
| Random vibration | PSD, frequency band, overall level, duration, axes and control strategy | Separate shock and sine-resonance evidence |
| Shock pulse | Pulse shape, peak, duration, direction and count | Separate long-duration fatigue evidence |
| Recorded time history | Sensor location, sample rate, filters, operating state, duration and scaling | Records for additional operating states and mounting points |
| Post-test observation | Exact functional check, method, limit and timing | Results for every additional required function |
How to measure motion relevant to the cable entry
A reproducible vibration record contains the raw signal and the information needed to interpret it. Select a sensor and acquisition chain with suitable calibration, frequency range, mounting, orientation, sampling, anti-alias filtering, and uncertainty. Anti-alias filtering prevents higher-frequency content from appearing incorrectly in sampled data.
NIST’s vibration calibration service shows why accelerometer sensitivity and phase depend on frequency. The sensor’s calibration, mounting, channel scale and acquisition settings determine how its signal becomes a measured acceleration.
Record overload, clipping, lost samples, or loose cables. Keep original units and coordinates, even if plots convert them, and preserve synchronization between channels. Each displayed acceleration value and exported plot should retain instrument range and calibration state.
Choose the sensor location from the question. If the concern is the motion entering the enclosure, measure at the enclosure near the entry and document the structural path. If cable motion is suspected, add an observation or measurement that captures the cable’s free span and support condition rather than assuming wall acceleration equals cable bending. Use three orthogonal axes when direction is not already bounded. Capture representative steady operation, starts, stops, speed changes, load changes, known impacts, and abnormal states that the test is meant to cover.
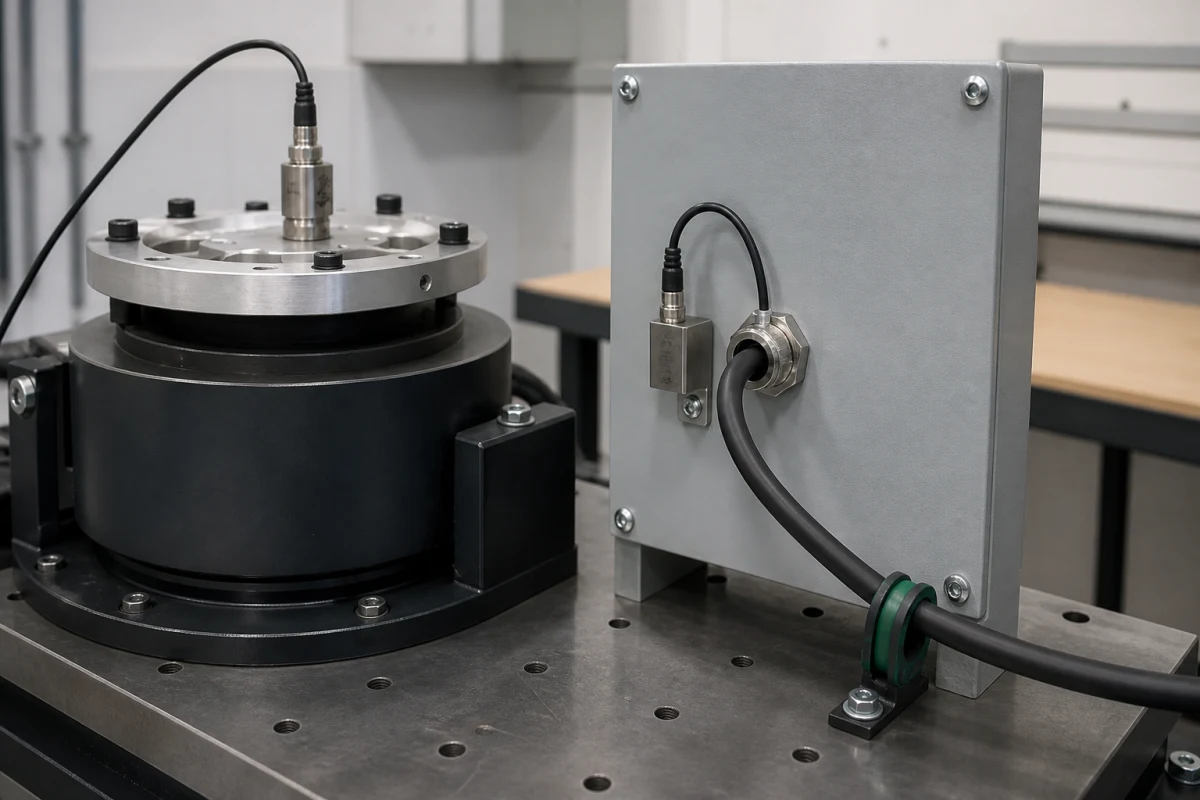
The fixture and panel sensors mark two measurement points, with a separate clamp defining the cable span and support arrangement.
Retain the raw time history. I would document windowing, filters, averaging, overlap, frequency resolution, clipping checks, and excluded intervals for each derived view. Power spectral density (PSD) shows how random-signal energy is distributed across frequency; the time history retains transient detail.
If the field profile is scaled or shortened for laboratory use, explain the transformation and its technical basis. Define the changed input, expected damage mechanism, duration, and acceptance boundary for an accelerated profile.
Which field and laboratory conditions must match?
Comparability requires four matches: dynamic input, measurement reference, installed configuration, and failure criterion. I would explain any difference before combining results.
Mounting can change the load at the gland. IEC 60068-2-47:2005 covers specimen mounting for vibration, impact, and similar dynamic tests. Fixtures, adaptors, fasteners, cable mass, free length, clamps, and panels can shift resonances or forces.
| Comparison field | Field record | Laboratory record | Effect of a difference |
|---|---|---|---|
| Dynamic input | Preserve waveform or time history, frequency band, severity, axes, and duration. | Use the controlled waveform or profile, band, level, axes, and run time. | Keep sine, random, shock, and recorded histories separate until the quantities can be compared. |
| Measurement reference | Identify sensor position, direction, bandwidth, filters, processing, and units. | Identify control and response points with the same measurement details. | Do not equate fixture input with panel or cable response; obtain a missing channel when needed. |
| Installed configuration | Match the gland, cable, panel, accessories, tightening, free length and cable support. | Match the specimen, fixture and cable support at the same level of detail. | Explain or retest a changed mount, clamp point, or cable span. |
| Functional criterion | Define each relevant retained function, its baseline, method, and limit. | Check the same functions and limits before and after exposure. | An unmeasured required function leaves performance unconfirmed. |
Compare each axis and operating state using the same quantity, units, reference point, bandwidth, duration and processing. A missing channel or frequency band can conceal a load the laboratory test never applied. Obtain that measurement before treating the two exposures as equivalent.
For one machine state, compare the field and laboratory traces in common units and check where each sensor sits. Frequency band, duration, amplitude definition and filtering determine whether the traces describe the same input. Gland size, cable OD, panel, clamp spacing and installation determine whether that input reaches the same assembly. Repeat the same functional checks before and after exposure.
A changed mount, clamp point or cable span can alter resonance and bending loads. Even a matched acceleration input may then produce a different response at the gland. Use a representative setup or evaluate that difference before applying the laboratory result to the installation.
For example, a field record may show a narrow tone near an assembly resonance while the laboratory report provides only an overall random level. Keep the two quantities separate. The next step may be a response investigation, a justified sine dwell, a random profile with the relevant band, or time-history replication. A recent method such as IEC 60068-2-86:2024 can support multi-exciter or multi-axis testing when the equipment-level question requires that arrangement.
Functional checks define whether the gland passed
A vibration pass means every required function meets its stated limit after the defined exposure. Visible survival is only one observation. Cable retention, seal contact, entry sealing, thread security, and jacket condition may all matter. Some designs also need armour-clamp or conductive-screen checks.
I would identify the applicable functions before testing. For each, define method, units, instrument, resolution, timing, and allowed change. Pre-test values provide the baseline needed to see drift. If a check destroys the specimen, retain its identity and test sequence. Measure every required function and record the result per sample.
Measure a baseline before exposure. Depending on the design question, useful checks can include cable position, gland dimensions, closure position, applied installation criterion, thread condition, panel damage, seal condition, retention displacement, leakage or ingress outcome, and electrical continuity or transfer performance for an applicable conductive design. Repeat the same checks after exposure and, when needed, at defined intervals during testing. Keep environmental conditioning in scope: the operating-temperature and sealing guide explains how to evaluate seal behavior across the assembly’s real temperature range.
Cable support deserves its own boundary. Provide system-level routing and support independently of the gland. An unsupported cable can impose cyclic bending or a bending moment that differs from a rigidly clamped laboratory lead. The strain-relief and sealing guide distinguishes cable restraint from environmental sealing. Record free length, clamp location, bend radius, connector mass, and motion at both ends so the result can be assigned to the correct load path.
Thread movement also needs a defined observation. Use paint marks to reveal gross relative rotation, then use the specified closure, preload, or seal check for the function being evaluated. Keep tightening torque within the exact product instruction and verify the panel, washer, locknut, engagement, lubrication condition, and tool method. The cable-gland torque guide explains how one universal torque value can damage the same interfaces it is meant to protect.
Turn field measurements into a representative test
A representative test preserves the damaging features relevant to the specimen and the decision, rather than copying one eye-catching peak. First identify operating states and credible exposure duration. Then determine which parts of the record are stationary, transient, tonal, random, or mixed. Decide whether the objective is response investigation, weakness discovery, endurance, transport qualification, shock survival, or reproduction of one recorded event. That objective controls the method and the functional checks.
I would keep input and response separate. The fixture’s control accelerometer measures controlled motion at that point. A panel or specimen response sensor may reveal amplified motion at resonance.
Use that response diagnostically, then set control levels from the objective, applicable limits, and field input. Define control points, tolerances, abort limits, any notching or force limiting, and all data channels before the run. Notching means reducing the commanded input in selected parts of the profile.
Finally, keep acceleration factors explicit. Raising amplitude or compressing time can change the failure mechanism, heat the specimen, introduce fixture behavior, or exceed the validity of a fatigue model. Convert test hours into service years only through a validated model for the relevant material and failure mechanism. Identify the model, variables, validation evidence, and uncertainty; otherwise report the actual test duration and conditions.
Compare field coverage with laboratory coverage
Compare field and laboratory coverage one named dimension at a time. A field capture may include an additional frequency, operating state, direction, transient, temperature, cable arrangement, or mounting condition. Record that difference as a coverage gap. To establish performance across the gap, evaluate the complete assembly with suitable measurements and stated acceptance checks.
A useful coverage statement names both records and the changed condition: “The recorded event included energy above the laboratory report’s frequency band.” Support it with the source files and processing details. A broader performance statement also needs the specification, model, configuration, additional severity, duration, axes, sample count, acceptance criteria, and results. Apply the same evidence chain to percentages, field-life equivalents, zero-failure statements, and cross-industry comparisons.
If field and lab results disagree, I would first check their comparison boundary. Review sensor position, calibration, clipping, filters, units, and coordinates. Then inspect fixture response, fasteners, cable support, product identity, installation, conditioning, and acceptance methods.
The cable-entry failure analysis guide helps separate initiating load, propagation path, and failed function. Trace which difference explains the disagreement and whether it creates a design risk.
Conclusion
Real-world vibration evidence and laboratory specifications are complementary. Field data identifies motion in a particular installation, while a controlled test evaluates a defined specimen under repeatable inputs. Compare them after waveform, reference point, mounting, cable support, configuration, and functional limits have been aligned.
I recommend comparing the same dynamic input, measurement point and installed load path, then checking retention, sealing, mechanical and applicable electrical functions. When a field condition lies outside the laboratory profile or mounting arrangement, the test result does not yet cover that condition. Use the missing measurements to define a representative test.
FAQ
Does a higher acceleration value mean the field condition is more severe?
No. Compare the quantity, units, waveform, frequency content, duration, direction, measurement point, and bandwidth. Shock peak, sine amplitude, and random RMS describe different conditions.
Can a field vibration recording be replayed directly on a shaker?
Sometimes, after reviewing the sensor location, coordinate system, fixture, control strategy, scaling, duration, and specimen limits. Never assume a recorded response is a suitable commanded input.
Which cable-gland functions should be checked after vibration?
Check every required function: cable retention, seal and jacket condition, thread or accessory movement, enclosure-interface damage, and any applicable ingress or electrical limit.
Does passing IEC 60068-2-6 prove performance under random vibration?
No. IEC 60068-2-6 is a sinusoidal method. Random vibration uses a different method, with separately defined severity, mounting, duration, axes, and acceptance criteria.
Can vibration test hours be converted directly into years of service?
Not by a universal factor. Without a validated model for the relevant failure mechanism, state the actual profile, duration, configuration, and observed outcomes.
Sources and technical references
- IEC 62444:2010, Cable glands for electrical installations, accessed 2026-09-30.
- IEC 60068-2-6:2007, Vibration (sinusoidal), accessed 2026-09-30.
- IEC 60068-2-64:2008, Vibration, broadband random and guidance, accessed 2026-09-30.
- IEC 60068-2-27:2008, Shock, accessed 2026-09-30.
- IEC 60068-3-8:2003, Selecting amongst vibration tests, accessed 2026-09-30.
- IEC 60068-2-85:2019, Vibration - Long time history replication, accessed 2026-09-30.
- NIST Vibration Calibration of Accelerometers, accessed 2026-09-30.
- IEC 60068-2-47:2005, Mounting of specimens for vibration, impact and similar dynamic tests, accessed 2026-09-30.
- IEC 60068-2-86:2024, Vibration - Multi-exciter and multi-axis method, accessed 2026-09-30.