# Weibull Reliability: How to Read B10 and Cable Entry Life Claims
> Source: https://chinacableglands.com/blog/weibull-cable-entry-reliability/
> Language: en
> Publisher: Bepto Cable Glands
> Author: Victor Huang
> Published: 2026-10-22
> Updated: 2026-10-29
## Summary
Read Weibull reliability, B10 and characteristic life with worked examples, censored observations, confidence bounds and cable-entry test conditions.
## Article
**Weibull reliability describes how failure probability changes with exposure time. B10 is the time at which that model reaches 10% cumulative failures; characteristic life is the time at about 63.2%.** I compare the stated life measure, test conditions and confidence bound before using a cable-entry life claim to make a decision.
The distinction matters. Two models can have the same characteristic life and quite different B10 values. A long test with few failures also carries different information from a long list of returned parts. Read the curve together with the population and the records used to fit it.
> **Key takeaways**
>
> - B10 describes the model's early-life percentile; it is different from mean or characteristic life.
> - Shape changes the failure-rate trend, while scale sets the characteristic time.
> - Include surviving specimens with their censoring times and status.
> - Compare a point estimate with the confidence bound required for the decision.
> - Connect accelerated test time to use conditions through the relevant mechanism and acceleration model.
## What do Weibull shape, scale and B10 mean?
**A Weibull model** is a probability distribution used to describe quantities such as time or cycles to failure. [IEC 61649:2008](https://webstore.iec.ch/en/publication/5698) provides analytical and graphical methods for Weibull analysis of sampled items in test or service. For a cable entry, define the assembly, exposure and failure event to which the model applies.
The two-parameter form uses a zero time origin, a positive shape parameter $\beta$ and a positive scale parameter $\eta$. For exposure time $t\geq0$, cumulative failure probability is:
$$
F(t)=1-\exp\left[-\left(\frac{t}{\eta}\right)^\beta\right]
$$
**Survival probability** is the probability of remaining free of the defined failure through time $t$. It is $R(t)=1-F(t)$. Time and scale must use the same units; shape is dimensionless. This is the form given in [NIST's Weibull lifetime model](https://www.itl.nist.gov/div898/handbook/apr/section1/apr162.htm), with different symbols in some software.
**Characteristic life** is the scale $\eta$, where the model reaches $F(\eta)=1-e^{-1}$, about 63.2%. **Shape** controls the trend in the instantaneous failure rate among units still surviving. A value below 1 gives a decreasing rate, 1 gives a constant rate and a value above 1 gives an increasing rate.
I use the shape trend to direct an investigation. An increasing rate makes age-related degradation worth checking, while early failures may prompt a closer look at variation in installation or manufacture. The physical conclusion still comes from the specimens and exposure history: the same statistical shape can arise from different mechanisms.
**B10 life** is the tenth percentile of the failure distribution. In the same model, 90% of the population survives to that exposure. Using the [NIST quantile relationship](https://www.itl.nist.gov/div898/handbook/eda/section3/eda3668.htm):
$$
t_{B10}=\eta[-\ln(0.9)]^{1/\beta}
$$
The logarithm is natural, and the result has the same units as $\eta$. Mean life is a separate average that depends on both parameters. A three-parameter Weibull adds a location or shift parameter, so confirm the model form before applying this zero-location equation.
## Worked example: the same characteristic life gives different B10
Consider three illustrative models with deliberately chosen parameters. These are mathematical examples, separate from the six-specimen dataset later in the article.
| Model | Shape | Characteristic life | Calculated B10 | Failure probability at 500 h |
| --- | ---: | ---: | ---: | ---: |
| A | 1 | 1,000 h | 105.4 h | 39.35% |
| B | 2 | 1,000 h | 324.6 h | 22.12% |
| C | 2 | 1,500 h | 486.9 h | 10.52% |
For B, insert the assumed scale of 1,000 h and shape of 2 into the B10 equation. The square root of $-\ln(0.9)$ is about 0.32459, giving 324.6 h. A has the same scale but a different shape, so its B10 is much earlier.
I would compare B10 or failure probability at the required exposure when early failures are the concern. Scale alone hides that difference. At 500 h, B has a lower cumulative failure probability than A. At 2,000 h, the order reverses: A gives 86.47%, while B gives 98.17%. The two curves meet at their shared 1,000 h characteristic life.
Calculated curves show how shape changes the distribution and scale moves its characteristic time. Each curve reaches 63.2 percent cumulative failures at its own scale value.
C shows the effect of increasing scale while keeping shape fixed. Its B10 is 1.5 times B's, matching the scale ratio. All three curves are calculated from the stated parameters; actual cable-entry comparisons require models fitted to relevant observations and assessed with their uncertainty.
For a report that quotes a duration alone, identify whether it means B10, a mean, characteristic life, a test endpoint or a planned operating period. The [long-term durability guide](/blog/long-term-value-the-durability-of-nickel-plated-brass-cable-glands-why-15-year-service-life-makes-initial-investment-worth-every-penny/) explains how service conditions and maintenance connect to that longer-term decision.
## Define the cable-entry population and failure event
**A population** is the set of assemblies the result is intended to describe. Fix the gland design, seal compound, cable jacket and diameter, mounting arrangement and installation condition. Where lots or variants differ, retain that identity so their effects can be checked rather than hidden by pooling.
Choose a functional endpoint before exposure starts. Leakage beyond a defined threshold, loss of retention and visible coating damage are different events. They can lead to different lifetime distributions. I choose the event that matches the engineering decision, then define the measurement method and threshold so every specimen is judged consistently.
The [water-ingress failure guide](/blog/the-physics-of-water-ingress-how-seals-fail-and-how-to-prevent-it/) helps distinguish leak paths through the cable seal and mounting interface. Those paths can require different inspections even when both lead to water inside the enclosure.
Keep one exposure clock for the analysis: operating hours, elapsed environmental exposure or counted cycles. Specify its start and how pauses are handled. First failure of an unrepaired assembly is the lifetime considered here. Repeated failures after repair require a model and data structure that describe repair and recurrence.
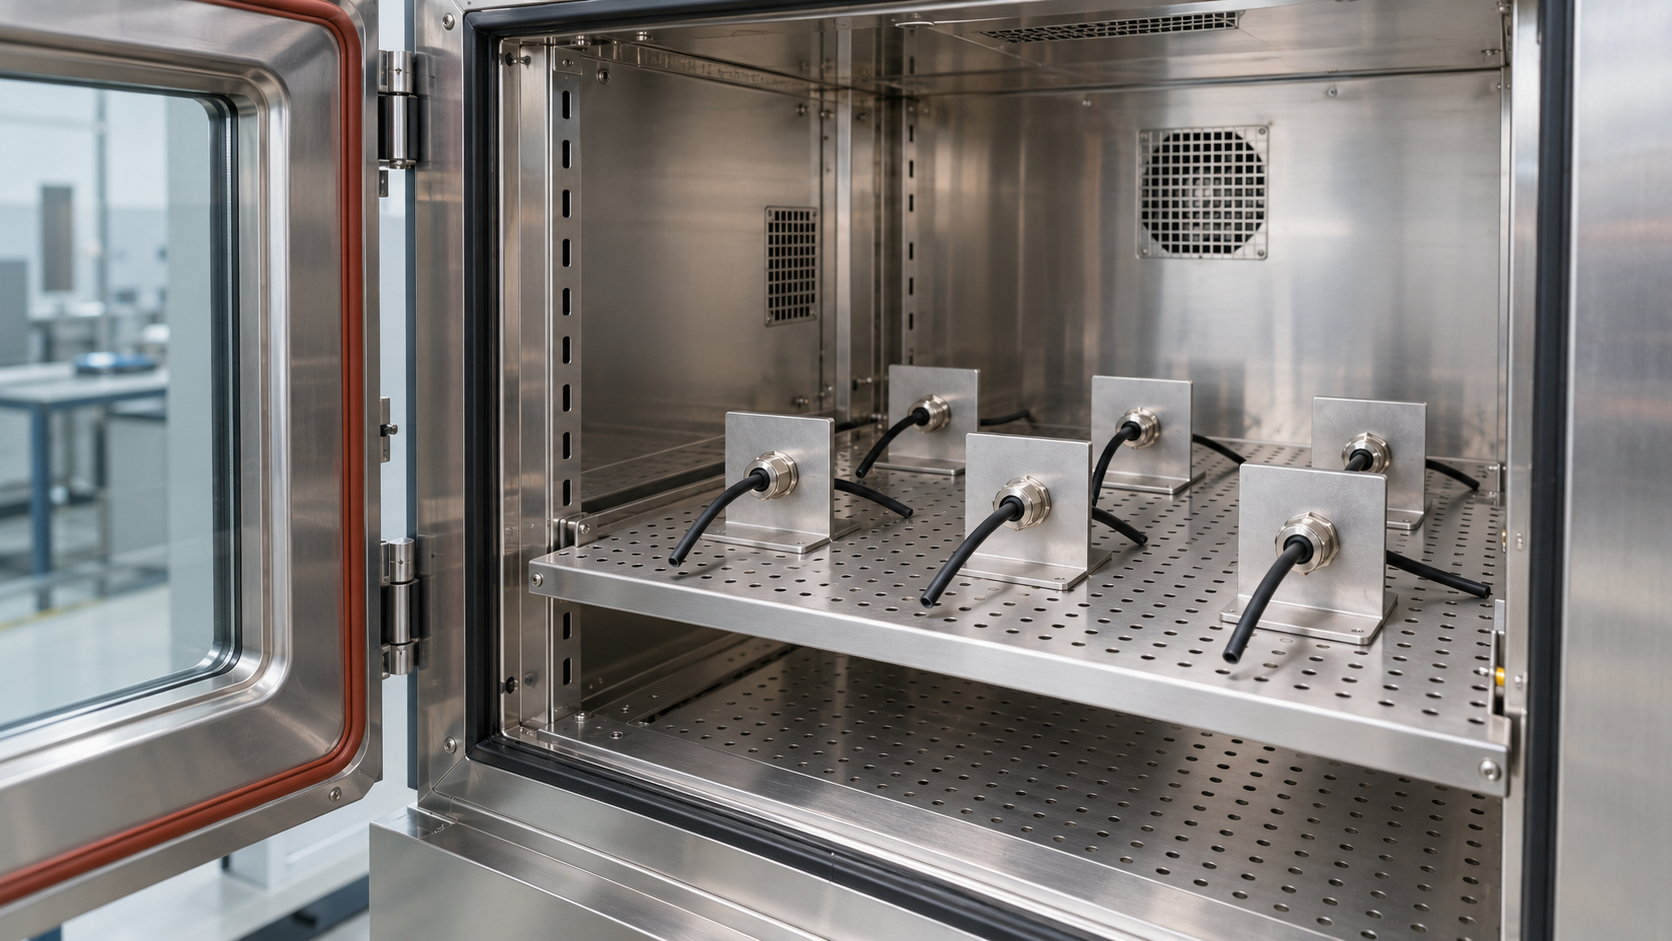
Separate cable-entry coupons occupy spaced positions on the chamber rack, each with its own gland and cable tails.
A random or otherwise justified sample should represent the population being discussed. Returned components can be valuable for diagnosis, but a return-only list omits the installed survivors. Connect failure records with the units still under observation and their exposure histories. The [durability testing guide](/blog/cable-gland-durability-testing-a-head-to-head-comparison-simulating-10-years-of-industrial-use/) explains how assembly definition and exposure planning fit together.
## Keep exact failures and censored records distinct
**Right censoring** means that a unit remained free of the defined failure through its last observation, while its later failure time is unknown. **Interval censoring** means the event occurred between two observation times. [NIST's censoring guidance](https://www.itl.nist.gov/div898/handbook/apr/section1/apr131.htm) explains these data types and why each belongs in the analysis.
Use the following hypothetical six-specimen dataset. Assume independent specimen lifetimes from the same population, a common exposure condition, continuous monitoring of the endpoint and a preplanned stop at 300 h.
| Specimen | Observation time | Status | Meaning |
| --- | ---: | --- | --- |
| A | 100 h | Failure | First defined failure occurred at 100 h |
| B | 180 h | Failure | First defined failure occurred at 180 h |
| C | 260 h | Failure | First defined failure occurred at 260 h |
| D | 300 h | Right censored | Survived through the test endpoint |
| E | 300 h | Right censored | Survived through the test endpoint |
| F | 300 h | Right censored | Survived through the test endpoint |
Keep a separate status field. The three entries at 300 h are survival observations, so their contribution differs from a failure recorded at 300 h. Dropping them loses the surviving half of the sample; recoding them as failures changes what happened.
If the endpoint is inspected periodically, record the last pass and first fail. A pass at 200 h followed by a fail at 250 h defines that interval. Use a fitting method that accepts intervals instead of assigning the midpoint or inspection time as an exact event.
I also keep the reason each observation ended. A planned stop supports a different censoring assumption from removing a specimen because it looks close to failure. Investigate such removals and their relationship to lifetime before choosing the analysis method.
## Fit the observations and check the model
**Maximum likelihood estimation**, or MLE, chooses parameters that make the recorded observations most consistent with the selected distribution. Exact failures contribute the probability density at their failure times; right-censored units contribute survival probability through their observation times. Interval observations contribute the probability of failure between the two readouts. [NIST's MLE guidance](https://www.itl.nist.gov/div898/handbook/apr/section4/apr412.htm) gives these distinct likelihood terms.
### Worked example: changing the status changes the result
For the six hypothetical records above, a two-parameter Weibull MLE with location fixed at zero gives shape about 2.047, scale 353.7 h and B10 117.8 h. The table compares that calculation with two deliberately incorrect treatments of the same entries.
| Treatment | Shape estimate | Scale estimate | B10 estimate | Data consequence |
| --- | ---: | ---: | ---: | --- |
| Three failures plus three right-censored survivors | 2.047 | 353.7 h | 117.8 h | Preserves the stated observations |
| Remove all three survivors | 3.121 | 202.2 h | 98.3 h | Fits only the failing subset |
| Mark all three 300 h survivors as failures | 4.016 | 266.0 h | 151.9 h | Introduces events absent from the example |
I found that recoding survivors as failures raises B10 in this hypothetical dataset: 151.9 h instead of 117.8 h. Dropping the same survivors lowers it to 98.3 h. Those opposite effects make the status field a priority when checking an imported report; a coding error may shift the answer in either direction. Use the correct statuses first, then assess fit and uncertainty. With only three observed failures, shape and lower-tail estimates are sensitive. More informative exposure and confidence analysis are needed for a strong engineering comparison.
A **probability plot** compares the observations with the model on transformed axes. It is different from the ordinary cumulative curves shown earlier. In [NIST's probability-plotting method](https://www.itl.nist.gov/div898/handbook/apr/section2/apr221.htm), plotting positions account for censoring. A broadly linear pattern supports consistency with the chosen model.
Investigate curvature, lot clusters, early outliers and specimen-position effects. Keep a point unless there is a documented measurement or population reason to handle it differently. Compare plausible distributions using the same observations. NIST's [worked Weibull example](https://www.itl.nist.gov/div898/handbook/apr/section4/apr413.htm) compares Weibull and lognormal fits with similar fit statistics, which illustrates why a visually neat curve alone leaves model choice uncertain.
Failure mechanisms can also compete. If corrosion ends observation before a leakage failure occurs, record both the ending event and the censored leakage time. [NIST's competing-risk model](https://www.itl.nist.gov/div898/handbook/apr/section1/apr181.htm) combines mechanisms under independence and first-failure assumptions. If joint movement promotes both corrosion and leakage, investigate that shared cause when choosing the model.
## Read the confidence bound beside the life estimate
**A confidence bound** expresses uncertainty in an estimated population quantity under the analysis assumptions. A lower confidence bound on B10 answers a different question from the B10 point estimate. Keep its confidence level, one-sided or two-sided form, and calculation method beside the value.
For example, suppose a requirement calls for a one-sided 95% lower confidence bound on B10 of at least 1,000 h. A hypothetical report with a B10 point estimate of 1,300 h and that lower bound of 900 h misses the requirement. The 300 h point-estimate surplus does not compensate for the 100 h shortfall in the requested bound.
I read the sample size and failure count with that comparison. A confidence interval concerns uncertainty in the estimated percentile or parameter; it is distinct from an interval containing that fraction of individual lifetimes. When comparing reports, use the same life measure, confidence convention, endpoint and exposure basis.
With zero failures, report how many units survived and for how long. In an unconstrained two-parameter Weibull fit, increasing scale can keep increasing the likelihood of all-survivor data, so the observations alone do not identify a finite shape-and-scale estimate. A separately specified reliability-demonstration method can use those survival results with its stated assumptions.
A useful reading sequence is to identify the life measure, inspect the observed and censored data, check the model fit, then compare the requested confidence bound. Follow up on whichever element controls the decision: exposure duration, number of failures, mixed populations or an uncertain mechanism.
## Connect accelerated test life to service conditions
A Weibull curve fitted at an elevated stress describes that condition. To project it to normal use, combine the lifetime distribution with an acceleration relationship for the relevant failure mechanism. [NIST's use-condition projection guidance](https://www.itl.nist.gov/div898/handbook/apr/section4/apr43.htm) explains why both models matter, especially when the service prediction lies in the sparsely observed early tail.
Check that the accelerated and service conditions preserve the mechanism. A higher temperature may change a seal's degradation process, while moisture, chemicals and movement can alter the assembly in different ways. Treat the stress history as part of the model rather than combining unrelated hours into one age counter. The [seal-aging guide](/blog/how-does-environmental-aging-affect-cable-gland-seal-performance-over-time/) connects these stresses with seal function.
I look for lower-stress, longer-duration or field observations that check the projection near intended use. Retain the test-condition estimate in its original hours or cycles, and state the use profile for a service prediction. A B10 value then remains tied to a specific population, failure event and exposure model as it moves into a maintenance or design decision.
## Conclusion
B10, characteristic life and mean life describe different parts of a Weibull lifetime model. The same characteristic life can conceal very different early-failure behavior, so compare the measure that matches the intended exposure and decision. Keep both failed and surviving specimens in the analysis with their correct status.
I read the confidence bound beside the point estimate, then check the population, failure definition and stress conditions. The worked examples show why those details change the numerical answer. For a service-life prediction, connect the test model to the actual mechanism and use profile before applying the result to maintenance or design choices.
## FAQ about Weibull reliability analysis
### Is Weibull characteristic life the average life?
Characteristic life is the scale value, where the two-parameter model reaches about 63.2% cumulative failures. Mean life depends on both shape and scale and is a different quantity. Read the named measure in the report before comparing durations; B10 focuses on the earlier tenth-percentile failure exposure.
### How should specimens that survive the test be recorded?
Keep the last observation time, right-censored status and reason observation ended. These records show survival through that time and contribute to the lifetime analysis. Use an analysis method that accepts censoring. For failures detected between inspections, retain the last-pass and first-fail interval instead of assigning an exact event time.
### What does B10 say about individual cable entries?
B10 is the model exposure at 10% cumulative failures, equivalent to 90% survival under the defined conditions. Some units fail earlier and some later. The estimate also has uncertainty, so compare its required confidence bound when judging a reliability target. Maintenance planning additionally considers the consequences of failure and the service profile.
### How can an accelerated Weibull curve support a service-life prediction?
Combine the life distribution with an acceleration model for the relevant mechanism and use conditions. Check that the mechanism remains applicable and compare the projection with suitable lower-stress, long-duration or field observations. Keep the population, failure criterion, exposure clock and uncertainty explicit when interpreting the projected life.
### Sources and technical references
- [IEC 61649:2008 — Weibull analysis](https://webstore.iec.ch/en/publication/5698), accessed 2026-10-29.
- [NIST — Censoring](https://www.itl.nist.gov/div898/handbook/apr/section1/apr131.htm), accessed 2026-10-29.
- [NIST — Weibull lifetime model](https://www.itl.nist.gov/div898/handbook/apr/section1/apr162.htm), accessed 2026-10-29.
- [NIST — Weibull distribution and quantiles](https://www.itl.nist.gov/div898/handbook/eda/section3/eda3668.htm), accessed 2026-10-29.
- [NIST — Maximum likelihood estimation](https://www.itl.nist.gov/div898/handbook/apr/section4/apr412.htm), accessed 2026-10-29.
- [NIST — Probability plotting](https://www.itl.nist.gov/div898/handbook/apr/section2/apr221.htm), accessed 2026-10-29.
- [NIST — Competing risk model](https://www.itl.nist.gov/div898/handbook/apr/section1/apr181.htm), accessed 2026-10-29.
- [NIST — A Weibull maximum likelihood estimation example](https://www.itl.nist.gov/div898/handbook/apr/section4/apr413.htm), accessed 2026-10-29.
- [NIST — Projecting reliability at use conditions](https://www.itl.nist.gov/div898/handbook/apr/section4/apr43.htm), accessed 2026-10-29.