# Contact vs Insulation Resistance: How to Read DC Test Results
> Source: https://chinacableglands.com/blog/contact-insulation-resistance-dc-tests/
> Language: en
> Publisher: Bepto Cable Glands
> Author: Victor Huang
> Published: 2026-10-22
> Updated: 2026-10-28
## Summary
Compare contact vs insulation resistance using mV/A and V/µA examples, defined measurement paths, reporting limits and the correct DC test conditions.
## Article
For **contact vs insulation resistance**, identify the current path first: along a conducting joint or across an insulating boundary. In DC test records, millivolts divided by amperes gives milliohms, while volts divided by microamperes gives megohms. A connector can require both low contact resistance and high insulation resistance because the two tests assess different paths.
I identify the measured points before reading the number. Then I check the units, test conditions and applicable limit. For actual testing, use qualified personnel, suitable equipment and the product's approved procedure to set the voltage, current, timing and safety controls. The numbers below are hypothetical records used to explain the arithmetic.
> **Key takeaways**
>
> - Name the conducting joint or insulating boundary represented by the result.
> - Keep the prefixes: 18 mV ÷ 3 A is 6 mΩ; 250 V ÷ 0.50 µA is 500 MΩ.
> - Compare results taken with the required sense points, current or voltage, timing and conditioning.
> - Preserve a validated reporting limit as an inequality, such as resistance greater than 5 GΩ.
> - Apply the specified resistance limit and assess heating or dielectric withstand with their own methods.
## Contact vs insulation resistance begins with the path
**Contact resistance** is the voltage drop across a conducting joint divided by the current through it. The joint may be a mated contact, termination or identified bonding connection. Include the same parts each time: moving a sense point along a conductor changes the measured path.
**Insulation resistance** is the applied DC voltage divided by leakage current between conductive parts separated by intended insulation. A test might span two contacts or a contact and a housing. State which parts are included, their assembly condition and any surface path covered by the requirement.
| Test | Physical path | Common input scale | Result scale |
| --- | --- | --- | --- |
| Contact resistance | Along a conducting joint | Measured mV drop and current in A | mΩ |
| Insulation resistance | Across an insulating boundary | Recorded V and leakage in µA | MΩ or GΩ |
The measurement boundary distinguishes current along a contact from leakage across intended insulation.
The upper path crosses a conducting contact; the lower path crosses the insulating region between separate conductors. In the actual test record, locate the specified electrodes or voltage-sense points on the assembly. A value spanning a whole cable and connector includes the parts between those points.
I keep protective bonding, signal contacts and insulating barriers separate when comparing requirements. The [protective-bonding guide](/blog/how-proper-electrical-bonding-and-grounding-with-cable-glands-saves-lives/) explains the role of the conductive safety path. A resistance requirement for that path applies to its specified test and construction.
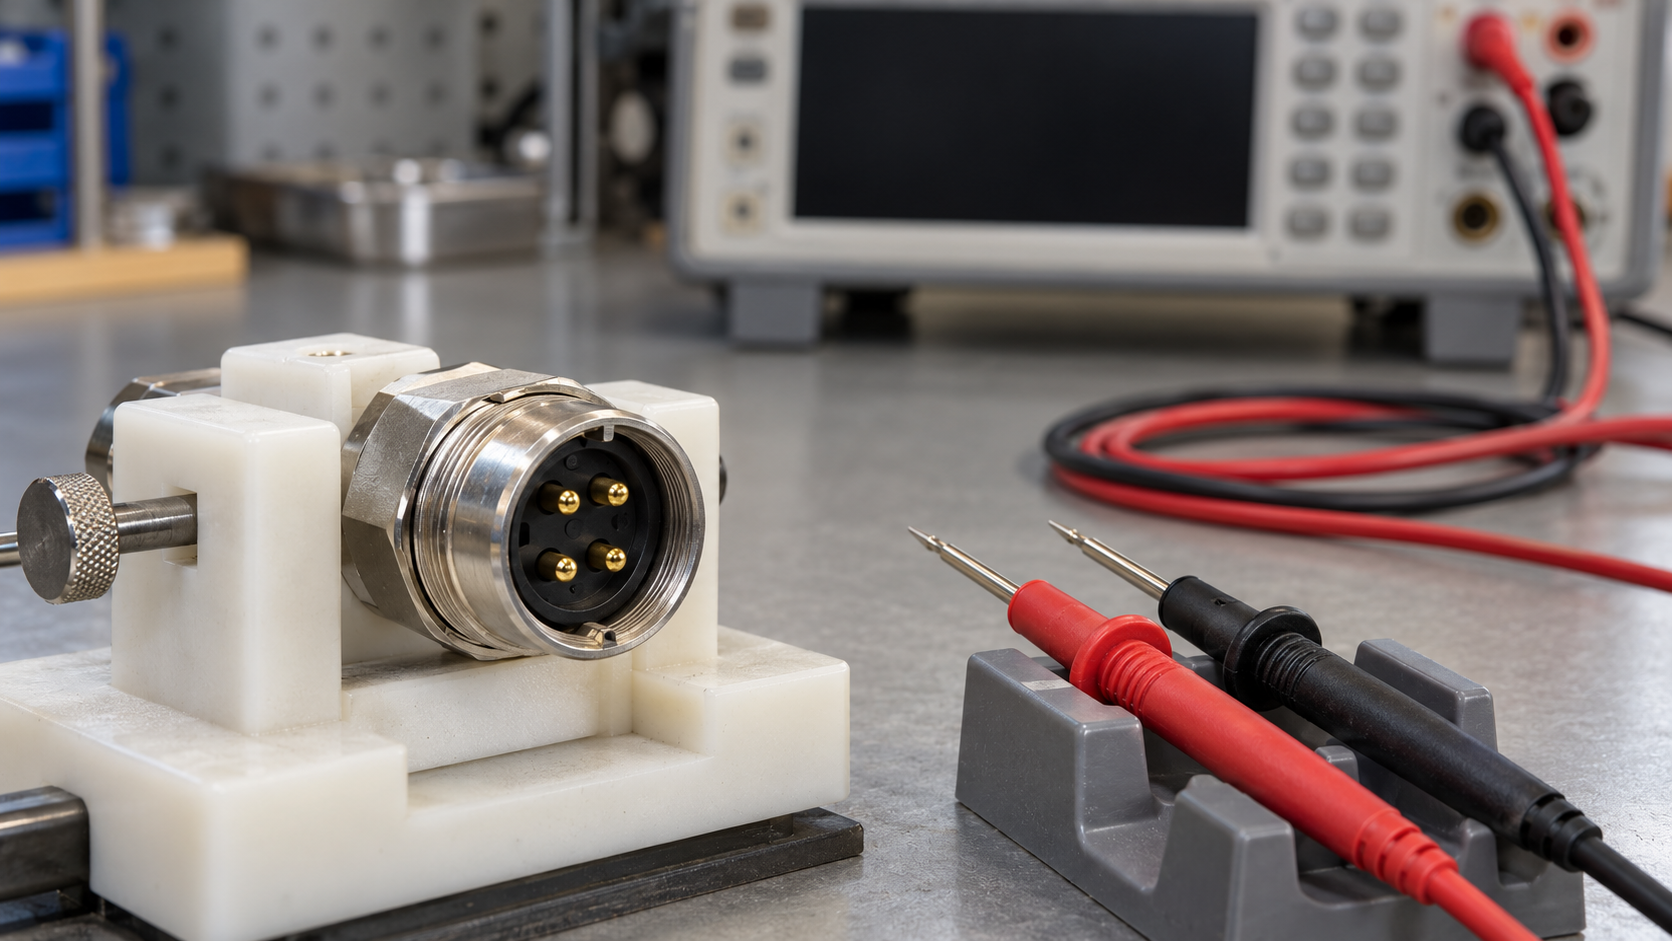
The fixture holds the connector with its metal shell, insulating insert and separate contact pins visible beside the resting probes.
## Convert millivolts and amperes into milliohms
The basic DC relationship is:
$$
R=\frac{V}{I}
$$
Use the voltage drop across the selected path and the current through it. With voltage in millivolts and current in amperes, the numerical quotient is in milliohms:
$$
R_{\mathrm{m\Omega}}=\frac{V_{\mathrm{mV}}}{I_{\mathrm{A}}}
$$
### Worked example: 18 mV at 3 A
The result is 18 ÷ 3 = **6 mΩ**, equivalent to **0.006 Ω**. In base units, 18 mV is 0.018 V, and 0.018 V ÷ 3 A gives the same answer. Treating 18 mV as 18 V would make the reported resistance one thousand times too large. Check that the recorded 18 mV is the drop between the intended sense points. A source voltage may also drive current through leads and other series connections. Dividing that total voltage by the current would describe a larger path. The [NIST SI unit table](https://www.nist.gov/pml/special-publication-811/nist-guide-si-chapter-4-two-classes-si-units-and-si-prefixes) defines the ohm as volts per ampere. I keep the input and output prefixes beside every number so the conversion remains visible when results move into a spreadsheet or report.
### Equal resistance can occur at different power levels
A second hypothetical record, 24 mV at 4 A, also gives 6 mΩ. For the stated resistive path, electrical power is $P=VI=I^2R$:
| Record | Calculated resistance | Electrical power in that path |
| --- | --- | --- |
| 18 mV at 3 A | 6 mΩ | 0.054 W |
| 24 mV at 4 A | 6 mΩ | 0.096 W |
The second record has the same resistance but greater power dissipation. Follow the prescribed test current when comparing results. Temperature rise also depends on time and heat flow into the surrounding assembly; the [connector temperature-rise guide](/blog/thermal-analysis-of-mc4-connectors-understanding-temperature-rise-and-derating/) explains that thermal assessment.
## Convert volts and microamperes into megohms
For a recorded voltage in volts and leakage current in microamperes:
$$
R_{\mathrm{M\Omega}}=\frac{V_{\mathrm{V}}}{I_{\mathrm{\mu A}}}
$$
Here is a compact check for the two scales:
| Recorded inputs | Convenient output | Conversion to ohms |
| --- | --- | --- |
| mV ÷ A | mΩ | Divide the milliohm result by 1,000 |
| V ÷ µA | MΩ | Multiply the megohm result by 1,000,000 |
### Worked example: 250 V and 0.50 µA
The result is 250 ÷ 0.50 = **500 MΩ**, or **0.50 GΩ**. In base units, 0.50 µA is 0.00000050 A. Dividing 250 V by that current gives 500,000,000 Ω. The assumed 250 V is a recorded value for this arithmetic example. Select the actual test voltage from the approved procedure for the product. Keep its measurement time and conditioning with the result so a later reading describes the same test state. I convert once in a clearly labelled step, then retain the chosen unit through the comparison. A column headed only “R” is easy to misread when low contact resistance and high insulation resistance appear on the same sheet. For a reported current limit, calculate the corresponding resistance bound and keep the inequality; the bound identifies what the recorded data actually resolve.
### [Measured electrical resistance](https://chinacableglands.com/resource-center/tools/electrical-test-resistance-calculator/)
Category: Electrical continuity
Calculate resistance from compatible measured DC voltage and current with separate contact and insulation measurement units.
Formula: ` R = V/I; contact: mV/A → mΩ; insulation: V/µA → MΩ `
Inputs:
- Resistance measurement
- Measured contact voltage drop
- Contact test current
- Measured insulation test voltage
Article note: Select contact mode for recorded mV and A, or insulation mode for V and µA. Use the defined measurement path and retain the output unit when applying the product's requirement.
## Keep measurement effects with the result
A **four-terminal measurement** is a method with separate current and voltage-sensing connections. For a low-resistance path, this reduces the contribution of lead voltage drops; the sense points define the measured region. Keithley's [Low Level Measurements Handbook, seventh edition](https://download.tek.com/document/LowLevelHandbook_7Ed.pdf), section 3.3.1, explains this method. For example, a hypothetical 30 µV offset at 3 A corresponds to 10 µΩ, or 0.010 mΩ. That is about 0.17% of the 6 mΩ example. I compare the possible contribution with the required uncertainty, then use the approved method's correction or verification step. Keep an assumed correction out of the recorded result. Contact test conditions can also change surface films. A specified low-level or dry-circuit test preserves a different contact state from a test that alters the film. Keep the prescribed voltage and current limits with the result when comparing contact measurements.
High resistance can depend on applied voltage. Unwanted surface or fixture leakage can add to the measured current. Use the specified connection, guarding and timing method for the path being assessed, keeping the intended surface contribution within the measurement.
| Detail | What to match before comparing |
| --- | --- |
| Measurement points | The same joint, termination or insulating boundary |
| Electrical conditions | Recorded values, units and prescribed current or voltage |
| Time and conditioning | Measurement timing, temperature, humidity and assembly state |
| Method | Instrument range, sense connections, uncertainty and included leakage paths |
| Requirement | The limit and decision rule for this product and test condition |
## Turn a reporting limit into a resistance bound
A **reporting limit** is the smallest value the method supports under its stated conditions. A display rounded to zero may fall below that level. Use the documented limit, rather than treating the displayed zero as an exact physical current.
### Worked example: leakage below 0.05 µA
Suppose a validated result states that positive leakage is **less than 0.05 µA at 250 V**. At the limiting current, 250 ÷ 0.05 = 5,000 MΩ, or 5 GΩ. A smaller positive current means a greater resistance, so report **R > 5 GΩ**. The greater-than sign carries the measurement information. Writing exactly 5 GΩ would lose it. Before using a bound, check that the method supports both the current threshold and the stated voltage; a blank or undocumented zero display supplies neither. For a contact measurement near zero voltage, use the instrument's validated range and uncertainty to describe the result. I keep an unresolved small value separate from an exact zero and apply the product's decision rule at that boundary.
## Compare the result with the correct requirement
Contact and insulation limits usually run in opposite directions. A maximum contact-path resistance limits voltage drop in the conducting joint. A minimum insulation resistance limits leakage across the insulating boundary under the specified test condition. [IEC 61984:2008](https://webstore.iec.ch/en/publication/6223) covers connector safety requirements and tests within its stated scope, including the role of a detail specification. Identify that specification and method before applying a limit; a connector test and a cable-gland bonding test can involve different objects. The table below uses hypothetical limits for the earlier records, assuming the measurement methods and conditions match. For an actual acceptance decision, use the product's stated limit and its treatment of measurement uncertainty. When a result is close to the limit, retaining the reported precision avoids changing the outcome through premature rounding.
| Example requirement | Recorded result | Numerical comparison |
| --- | --- | --- |
| Contact resistance at most 8 mΩ | 6 mΩ | 2 mΩ below the maximum |
| Insulation resistance at least 100 MΩ | 500 MΩ | 400 MΩ above the minimum |
### Resistance, dielectric withstand and temperature rise
**Dielectric withstand** evaluates the assembly under a specified electrical stress and acceptance method. **Dielectric strength** expresses a breakdown result relative to specimen thickness. **Temperature rise** measures how much the defined assembly warms under its load and surroundings. Each answers a different question from the DC resistance ratio.
Keep those results in their own fields when reading a report. The [dielectric-strength comparison](/blog/dielectric-strength-comparison-of-insulating-materials-used-in-cable-glands/) explains how specimen and method affect a breakdown result. A high insulation-resistance reading addresses the measured leakage path; a withstand test addresses its specified electrical stress.
## Conclusion
Read contact and insulation resistance by following the path, units and test conditions. The same voltage-over-current formula gives very different scales: mV divided by A gives mΩ, while V divided by µA gives MΩ. The worked records show how to convert those values and why equal resistance can still accompany different power dissipation.
I then compare the result with the requirement for that exact measurement. Keep sense points, timing, conditioning and uncertainty with it, and preserve a greater-than sign when the instrument supports a lower resistance bound. This makes the record useful for comparing conducting joints and insulating boundaries while keeping thermal and dielectric results distinct.
## FAQs about DC resistance test results
### Why can the same voltage-over-current formula describe both tests?
The ratio expresses resistance, while the physical path determines its meaning. A contact test follows a conducting joint; an insulation test spans an insulating boundary. Identify the points and test conditions, then use the unit scale that matches the recorded voltage and current.
### Is 18 mV divided by 3 A equal to 6 ohms?
It equals 6 milliohms, or 0.006 ohms. Convert 18 mV to 0.018 V when calculating in ohms. Alternatively, divide the numerical millivolt value by amperes and label the result in milliohms.
### Does a zero leakage-current display mean infinite insulation resistance?
Check the validated reporting limit behind the display. If the method establishes leakage below 0.05 µA at 250 V, the corresponding resistance is greater than 5 GΩ. Keep that inequality; an undocumented zero provides no numerical bound.
### Can a low contact-resistance result replace a temperature-rise test?
Assess temperature rise using the applicable thermal method. Contact resistance affects electrical power loss, while current, time, conductor configuration and heat flow affect the assembly's temperature. Keep the resistance result and thermal result linked to their respective test conditions.
### Sources and technical references
- [NIST — Guide to the SI, Chapter 4: The Two Classes of SI Units and the SI Prefixes](https://www.nist.gov/pml/special-publication-811/nist-guide-si-chapter-4-two-classes-si-units-and-si-prefixes), accessed 2026-10-28.
- [Keithley/Tektronix — Low Level Measurements Handbook, seventh edition](https://download.tek.com/document/LowLevelHandbook_7Ed.pdf), accessed 2026-10-28.
- [IEC 61984:2008 — Connectors, Safety requirements and tests](https://webstore.iec.ch/en/publication/6223), accessed 2026-10-28.